
What is AWR
AWR stands for Automated Workload Repository.
It is a built-in repository that exists in every Oracle Database.
Oracle have provided many performance gathering and reporting tools over the years.
Originally the UTLBSTAT/UTLESTAT scripts were used to monitor performance metrics.
At regular intervals, the Oracle Database makes a snapshot of all of its vital statistics.
The workload information is stored in the AWR.
AWR was first introduced with Oracle 10g.
AWR Features
The AWR is used to collect performance statistics including:
Wait events used to identify performance problems.
Time model statistics indicating the amount of DB time associated with a process.
Active Session History (ASH) statistics.
Object usage statistics.
Resource intensive SQL statements.
Step 1 : Snapshots
By default snapshots of the relevant data are taken every hour and retained for 7 days.
The default values for these settings can be altered using the following procedure.
BEGIN
DBMS_WORKLOAD_REPOSITORY.modify_snapshot_settings(
retention => 43200, -- Minutes (= 30 Days). Current value retained if NULL.
interval => 30); -- Minutes. Current value retained if NULL.
END;
/
Step 2 : Baselines
A baseline is a pair of snapshots that represents a specific period of usage.
Once baselines are defined they can be used to compare current performance against similar periods in the past.
We create baseline to represent a period of batch processing.
BEGIN
DBMS_WORKLOAD_REPOSITORY.create_baseline (
start_snap_id => 210,
end_snap_id => 220,
baseline_name => 'batch baseline');
END;
/
The snapshots associated with a baseline are retained until the baseline is explicitly deleted.
BEGIN
DBMS_WORKLOAD_REPOSITORY.drop_baseline (
baseline_name => 'batch baseline',
cascade => FALSE); -- Deletes associated snapshots if TRUE.
END;
/
Step 3 : Workload Repository Reports
Oracle provides two scripts to produce workload repository reports.
1)awrrpt.sql
2)awrrpti.sql)
The reports can be generated by running the above scripts in sqlplus.
@$ORACLE_HOME/rdbms/admin/awrrpt.sql
@$ORACLE_HOME/rdbms/admin/awrrpti.sql
The scripts prompt you to enter the report format (html or text), the start snapshot id, the end snapshot id and the report filename.
The resulting report can be opened in a browser or text editor.
Step 4 : Workload Repository Reports Usage
If you are new to the AWR reports, the first thing you should probably do is run the ADDM report.
The ADDM report provides root cause analysis of the parts of the system consuming the most time.
When looking at an AWR report, a good place to start is the "Top 5 Timed Foreground Events" section.
This gives you an indication of the bottlenecks in the system during this sample period.

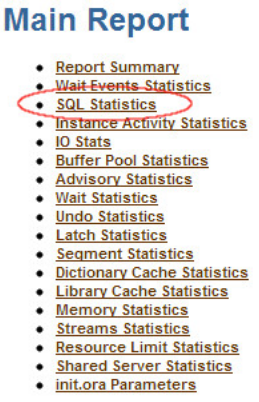
Once you've identified the top events, drill down to see what SQL and PL/SQL are consuming the majority of those resources.
On the "Main Report" section, click the "SQL Statistics" link.

On the "SQL Statistics" section, click the link that most closely relates to the wait event you identified in the "Top 5 Timed Foreground Events" section.
In our case, the "DB CPU" was the top event.

You will be then presented with the SQL and PL/SQL that are using most of the specified resource during the sample period.
You can then attempt to tune these areas to reduce the impact.

SQL Developer and AWR Reports
If you are using SQL Developer 4 onward, you can view AWR reports directly from SQL Developer.
If it is not already showing, open the DBA pane "View > DBA", expand the connection of interest, then expand the "Performance" node.
The AWR reports are available from the "AWR" node.

AWR stands for Automated Workload Repository.
It is a built-in repository that exists in every Oracle Database.
Oracle have provided many performance gathering and reporting tools over the years.
Originally the UTLBSTAT/UTLESTAT scripts were used to monitor performance metrics.
At regular intervals, the Oracle Database makes a snapshot of all of its vital statistics.
The workload information is stored in the AWR.
AWR was first introduced with Oracle 10g.
AWR Features
The AWR is used to collect performance statistics including:
Wait events used to identify performance problems.
Time model statistics indicating the amount of DB time associated with a process.
Active Session History (ASH) statistics.
Object usage statistics.
Resource intensive SQL statements.
Step 1 : Snapshots
By default snapshots of the relevant data are taken every hour and retained for 7 days.
The default values for these settings can be altered using the following procedure.
BEGIN
DBMS_WORKLOAD_REPOSITORY.modify_snapshot_settings(
retention => 43200, -- Minutes (= 30 Days). Current value retained if NULL.
interval => 30); -- Minutes. Current value retained if NULL.
END;
/
Step 2 : Baselines
A baseline is a pair of snapshots that represents a specific period of usage.
Once baselines are defined they can be used to compare current performance against similar periods in the past.
We create baseline to represent a period of batch processing.
BEGIN
DBMS_WORKLOAD_REPOSITORY.create_baseline (
start_snap_id => 210,
end_snap_id => 220,
baseline_name => 'batch baseline');
END;
/
The snapshots associated with a baseline are retained until the baseline is explicitly deleted.
BEGIN
DBMS_WORKLOAD_REPOSITORY.drop_baseline (
baseline_name => 'batch baseline',
cascade => FALSE); -- Deletes associated snapshots if TRUE.
END;
/
Step 3 : Workload Repository Reports
Oracle provides two scripts to produce workload repository reports.
1)awrrpt.sql
2)awrrpti.sql)
The reports can be generated by running the above scripts in sqlplus.
@$ORACLE_HOME/rdbms/admin/awrrpt.sql
@$ORACLE_HOME/rdbms/admin/awrrpti.sql
The scripts prompt you to enter the report format (html or text), the start snapshot id, the end snapshot id and the report filename.
The resulting report can be opened in a browser or text editor.
Step 4 : Workload Repository Reports Usage
If you are new to the AWR reports, the first thing you should probably do is run the ADDM report.
The ADDM report provides root cause analysis of the parts of the system consuming the most time.
When looking at an AWR report, a good place to start is the "Top 5 Timed Foreground Events" section.
This gives you an indication of the bottlenecks in the system during this sample period.
Once you've identified the top events, drill down to see what SQL and PL/SQL are consuming the majority of those resources.
On the "Main Report" section, click the "SQL Statistics" link.
On the "SQL Statistics" section, click the link that most closely relates to the wait event you identified in the "Top 5 Timed Foreground Events" section.
In our case, the "DB CPU" was the top event.

You will be then presented with the SQL and PL/SQL that are using most of the specified resource during the sample period.
You can then attempt to tune these areas to reduce the impact.
SQL Developer and AWR Reports
If you are using SQL Developer 4 onward, you can view AWR reports directly from SQL Developer.
If it is not already showing, open the DBA pane "View > DBA", expand the connection of interest, then expand the "Performance" node.
The AWR reports are available from the "AWR" node.
No comments:
Post a Comment